- 您現(xiàn)在的位置:買賣IC網(wǎng) > PDF目錄383693 > OPA628 Low Distortion Wideband OPERATIONAL AMPLIFIER PDF資料下載
參數(shù)資料
| 型號: | OPA628 |
| 英文描述: | Low Distortion Wideband OPERATIONAL AMPLIFIER |
| 中文描述: | 低失真寬帶運(yùn)算放大器 |
| 文件頁數(shù): | 11/13頁 |
| 文件大小: | 172K |
| 代理商: | OPA628 |

11
OPA628
INPUT PROTECTION
Static damage has been well recognized for MOSFET de-
vices, but any semiconductor device deserves protection
from this potentially damaging source. The OPA628 incor-
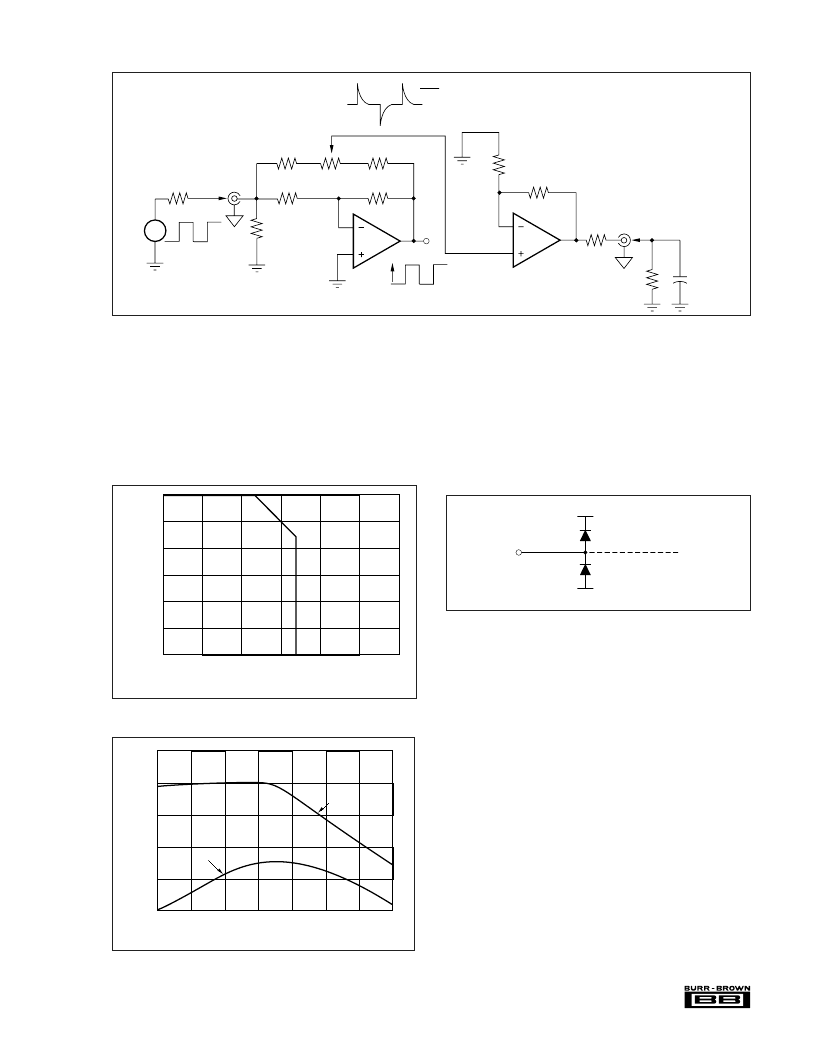
porates on-chip ESD protection diodes as shown in Figure 8.
This eliminates the need for the user to add external protec-
tion diodes, which can add capacitance and degrade AC
performance.
Note that the short circuit condition represents the maximum
amount of internal power dissipation that can be generated.
Thus, the “Maximum Power Dissipation” curve starts at
1.2W and is derated based on a 175
°
C maximum junction
temperature and the junction-to-ambient thermal resistance,
θ
JA
, of the package. The variation of short circuit current
with temperature is shown in Figure 7.
External
Pin
+V
CC
–V
CC
Internal
Circuitry
All pins on the OPA628 are internally protected from ESD
by means of a pair of back-to-back reverse-biased diodes to
either power supply as shown. These diodes will begin to
conduct when the input voltage exceeds either power supply
by about 0.7V. This situation can occur with loss of the
amplifier’s power supplies while a signal source is still
present. The diodes can typically withstand a continuous
current of 30mA without destruction. To insure long term
reliability, however, diode current should be externally lim-
ited to approximately 10mA whenever possible.
OFFSET VOLTAGE ADJUSTMENT
The OPA628’s input offset voltage is laser-trimmed and will
require no further adjustment for most applications. How-
ever, if additional adjustment is needed, the circuit in Figure
9 can be used without degrading offset drift with tempera-
ture. Avoid external adjustment whenever possible since
extraneous noise, such as power supply noise, can be inad-
vertently coupled into the amplifier’s inverting input termi-
nal. Remember that additional offset errors can be created by
OPA628
50
R
2
50
G = –n
a
1M
15pF
Tektronix11402
OPA620
nR
1
nR
2
c
b
G = n+1
R
3
nR
3
50
1
n+1
of settling response at b
2V
R
1
R
1
FIGURE 5. Settling Time Test Circuit.
200
180
160
140
120
100
–50
–25
0
25
50
75
100
125
S
Temperature (°C)
Source
Sink
FIGURE 7. Short Circuit Current vs Temperature.
1.2
1.0
0.8
0.6
0.4
0.2
0
0
+25
+50
+75
+100
+125
+150
Ambient Temperature (°C)
I
FIGURE 6. Maximum Power Dissipation.
FIGURE 8. Internal ESD Protection.
相關(guān)PDF資料 |
PDF描述 |
|---|---|
| OPA654 | Wide Bandwidth, High Output Current Difet OPERATIONAL AMPLIFIER |
| OPA654AM | Wide Bandwidth, High Output Current Difet OPERATIONAL AMPLIFIER |
| OPA655 | Wideband, Unity Gain Stable, FET-Input OPERATIONAL AMPLIFIER |
| OPA655P | Wideband, Unity Gain Stable, FET-Input OPERATIONAL AMPLIFIER |
| OPA655U | Wideband, Unity Gain Stable, FET-Input OPERATIONAL AMPLIFIER |
相關(guān)代理商/技術(shù)參數(shù) |
參數(shù)描述 |
|---|---|
| OPA628A WAF | 制造商:Texas Instruments 功能描述: |
| OPA628AP | 制造商:Texas Instruments 功能描述:Part Number Only |
| OPA628AU | 制造商:Rochester Electronics LLC 功能描述:- Bulk |
| OPA628U | 制造商:BB 制造商全稱:BB 功能描述:EVALUATION FIXTURE |
| OPA62K5 | 制造商:TI 制造商全稱:Texas Instruments 功能描述:Wideband, Unity-Gain Stable, FET-Input OPERATIONAL AMPLIFIER |
發(fā)布緊急采購,3分鐘左右您將得到回復(fù)。