- 您現(xiàn)在的位置:買賣IC網(wǎng) > PDF目錄383838 > ST20-SWC-SUN Stratix II GX FPGA 30K FPGA-780 PDF資料下載
參數(shù)資料
| 型號: | ST20-SWC-SUN |
| 英文描述: | Stratix II GX FPGA 30K FPGA-780 |
| 中文描述: | 的ST20軟件開發(fā)和調(diào)試工具 |
| 文件頁數(shù): | 1/21頁 |
| 文件大?。?/td> | 360K |
| 代理商: | ST20-SWC-SUN |
The information in this datasheet is subject to change
42 1669 01
December 1995
1/21
ST20 TOOLSET
ST20–SWC
ST20 software development and debugging tools
PRODUCT INFORMATION
+.2$01
')$ 5 $"21',+
3$+10
/' !)$0
-1',+0
'+#,4
$)-
/,%/ *
!,+0.,)!
do
{
printf(”Please type n : ”);
} while (scanf(”%d”, &n) !=1);
30
31
32
33
34
35
36
37
38
return (n);
}
void close_down (Channel *in, Channel *o
,+1'+2$
+1$//2-1
1$-
$51
1$- 21
1$-,
/$ (
1"&
$)$1$
/'+1
2*-
/'+1
," 1$
01 31
FEATURES
ANSI C compiler (X3.159-1989).
Excellent compile time diagnostics.
Global and local optimization.
Assembler inserts and stand alone assembler.
Support for EPROM programming.
Support for placing code and data in user specified
memory locations.
Support for dynamically loading programs and
functions.
Small runtime overhead.
Cross-development from PC and Sun-4 platforms.
Support for trap and interrupt handlers.
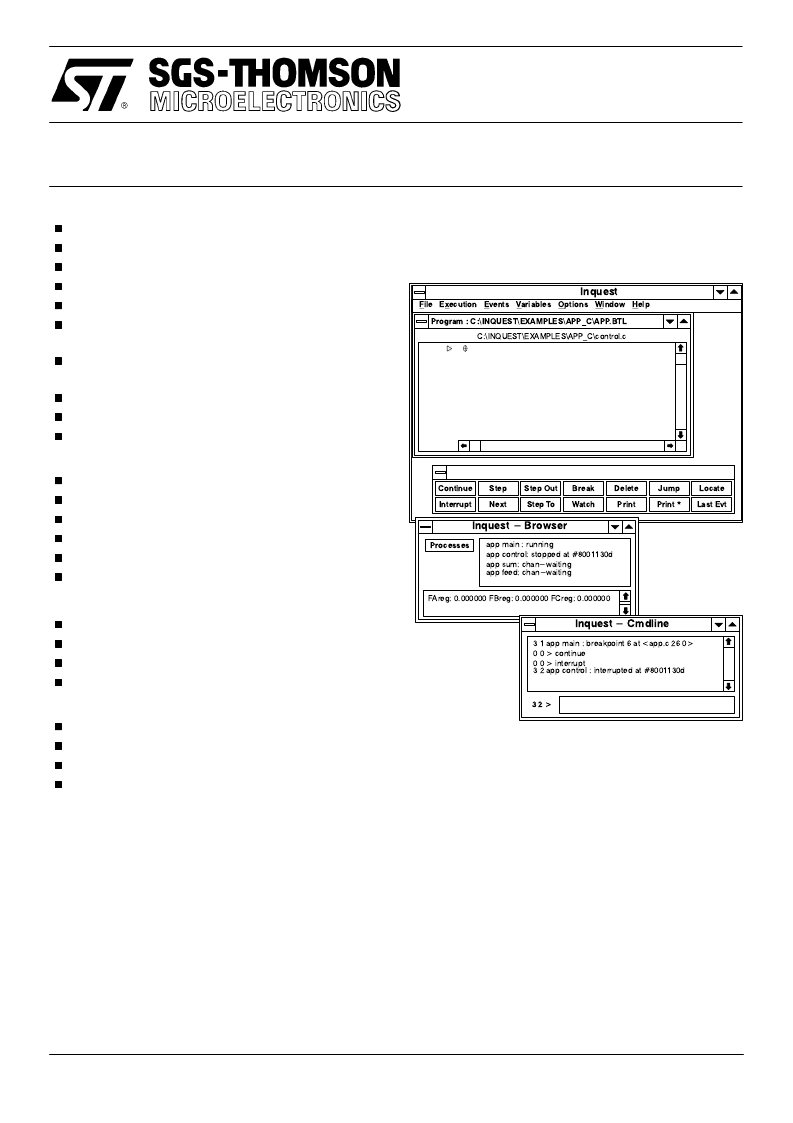
INQUEST Interactive and post-mortem debugging:–
Windowing interface using X Windows or Windows.
Programmable command language.
Source code or assembly code view.
Stack trace-back facility.
Variable and Memory display facility.
C expression interpreter.
INQUEST Interactive debugging:–
Process and thread break points.
Single stepping of threads.
Read/Write/Access watch point capability.
Facilities to interrupt and find threads.
Performance analysis tools:–
Analysis of time spent in each function.
Analysis of block execution frequency.
Analysis of processor idle time.
Analysis of processor utilization.
DESCRIPTION
The ST20 ANSI C Toolset provides a complete high
quality software development environment for the ST20
microcontroller and microprocessor. The compiler
supports the full ANSI C language definition and
includes both local and global optimizing features.
Embedded application support is provided by both
configuration and symbol map utilities.
An interactive windowing debuggerprovides single
stepping, breakpoints, watchpoints and many other
features for debugging sequential and multi-tasking
programs. Execution profilersgive various post-mortem
statistical analyses of the execution of a program.
+.2$01 /,40$/
-- *'+ .1++'+%
-- !,+0.,) /0,--#" 0 "
-- /1* !&+2'0'+%
-- $##" !&+2'0'+%
.#% .#% .#%
/,"$00$0
+.2$01 *#)'+$
-- *'+ .#(-,'+0 0 --!
!,+0'+1#
'+0#..1-0
-- !,+0.,) '+0#..1-0#" 0 "
相關(guān)PDF資料 |
PDF描述 |
|---|---|
| ST203C10CFJ0 | Stratix II GX FPGA 130K FPGA-1508 |
| ST203C12CFJ0 | Stratix II GX FPGA 130K FPGA-1508 |
| ST203S10PFJ0 | Stratix II GX FPGA 130K FPGA-40 |
| ST203S12PFJ0 | Stratix II GX FPGA 90K FPGA-35 |
| ST2044 | Stratix II FPGA 130K FBGA-1020 |
相關(guān)代理商/技術(shù)參數(shù) |
參數(shù)描述 |
|---|---|
| ST20TOOLSET | 制造商:未知廠家 制造商全稱:未知廠家 功能描述:ST20 software development and debugging tools |
| ST20-TOOLSET/PC | 制造商:STMicroelectronics 功能描述:ST20 DEVELOPMENT TOOLS - Bulk |
| ST20TP1X40S | 制造商:未知廠家 制造商全稱:未知廠家 功能描述:Interface IC |
| ST20TP2X40S | 制造商:未知廠家 制造商全稱:未知廠家 功能描述:Communications Interface |
| ST20TP2X50S | 制造商:未知廠家 制造商全稱:未知廠家 功能描述:Communications Interface |
發(fā)布緊急采購,3分鐘左右您將得到回復(fù)。