- 您現(xiàn)在的位置:買賣IC網(wǎng) > PDF目錄371142 > MPXT2010G7U (Motorola, Inc.) COMPENSATED PRESSURE SENSOR PDF資料下載
參數(shù)資料
| 型號(hào): | MPXT2010G7U |
| 廠商: | Motorola, Inc. |
| 英文描述: | COMPENSATED PRESSURE SENSOR |
| 中文描述: | 補(bǔ)償壓力傳感器 |
| 文件頁數(shù): | 3/4頁 |
| 文件大小: | 91K |
| 代理商: | MPXT2010G7U |
3
Motorola Sensor Device Data
ON–CHIP TEMPERATURE COMPENSATION and CALIBRATION
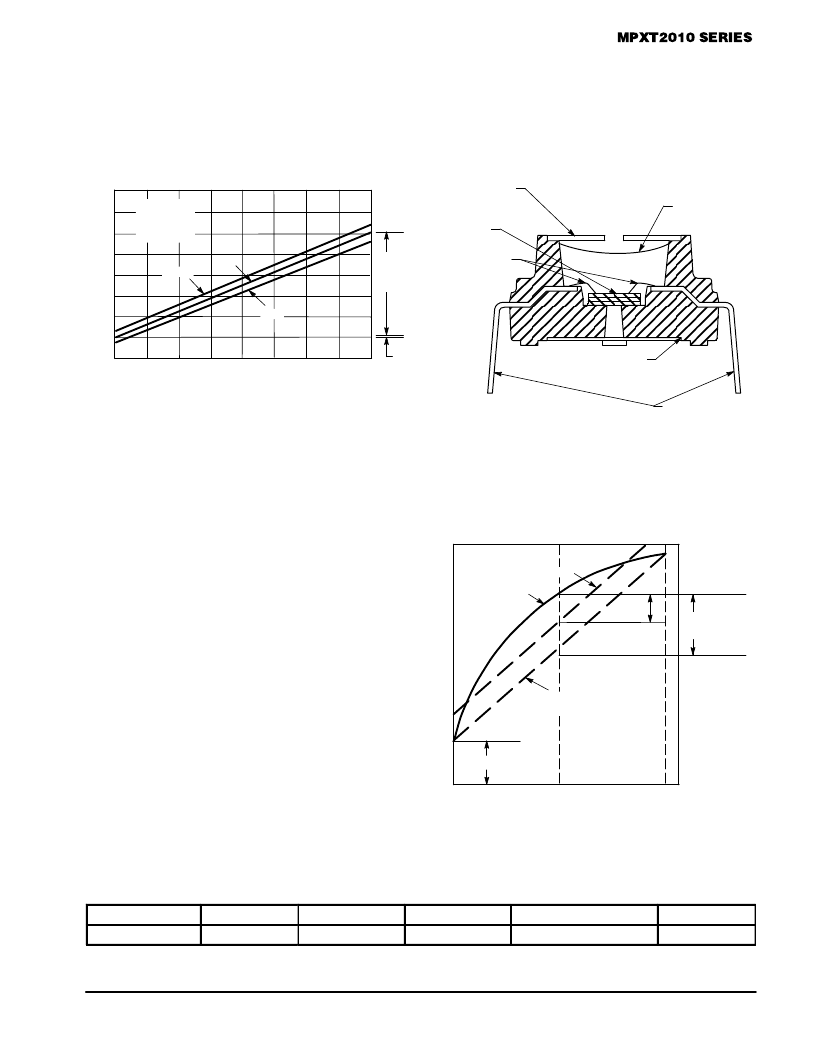
Figure 2 shows the output characteristics of the MPXT2010
series at 25
°
C. The output is directly proportional to the dif-
ferential pressure and is essentially a straight line.
The effects of temperature on full scale span and offset are
small and are shown under Operating Characteristics.
Figure 3 illustrates the differential/gauge die in the basic
chip carrier (Case 473). A silicone gel isolates the die surface
and wire bonds from the environment, while allowing the
pressure signal to be transmitted to the silicon diaphragm.
Figure 2. Output versus Pressure Differential
Figure 3. Cross–Sectional Diagram (not to scale)
MIN
TYP
OFFSET
(TYP)
30
20
15
10
5
O 25
0
–5
kPa
PSI
2.5
0.362
5
0.725
7.5
1.09
10
1.45
a
MAX
SPAN
RANGE
(TYP)
VS = 10 Vdc
TA = 25
°
C
P1 > P2
éééééééééééé
éééééééééééé
éééééééééééé
éééééééééééé
éééééééééééé
FLUORO SILICONE
DIE COAT
WIRE BONDS
LEAD FRAME
DIE
STAINLESS STEEL
METAL COVER
EPOXY CASE
P1
The MPXT2010 series pressure sensor operating charac-
teristics, internal reliability and qualification tests are based
on use of dry air as the pressure media. Media other than dry
air may have adverse effects on sensor performance and
long term reliability. Contact the factory for information re-
garding media compatibility in your application.
LINEARITY
Linearity refers to how well a transducer’s output follows
the equation: Vout = Voff + (sensitivity x P) over the operating
pressure range. There are two basic methods for calculating
nonlinearity: (1) end–point straight line fit, or (2) a least
squares best line fit (see Figure 4).
When calculating linearity, Motorola uses the end–point
straight line fit. This method measures the two end and the
mid range pressure points and compares to ideal. This typi-
cally represents the “worst case” error which is often more
desirable for the customers when calculating an error budget
in their designs.
Figure 4. Linearity Specification Comparison
LEAST
SQUARE
DEVIATION
R
PRESSURE (% FULLSCALE)
0
50
100
END POINT
STRAIGHT LINE FIT
EXAGGERATED
PERFORMANCE
CURVE
LEAST SQUARES FIT
STRAIGHT LINE
DEVIATION
OFFSET
ORDERING INFORMATION
The MPXT2010G7U pressure sensor is available to be shipped in Rails.
Packing Options
Port Options
Leadform
Case No.
MPXS Series Order No.
Marking
Rails
Element
84 degree
473A–01
MPXT2010G7U
MPXT2010G
相關(guān)PDF資料 |
PDF描述 |
|---|---|
| MPXT2010 | 4 MEGABIT 3.3 VOLT SERIAL CONFIGURATION - NOT RECOMMENDED for NEW DESIGN |
| MPXT4101A7U | X-ducer SILICON PRESSURE SENSORS |
| MPXT4100A7U | M39012 MIL RF CONNECTOR |
| MPXT4100 | 4 MEGABIT 3.3 VOLT SERIAL CONFIGURATION - NOT RECOMMENDED for NEW DESIGN |
| MPXT4105A7U | X-ducer SILICON PRESSURE SENSORS |
相關(guān)代理商/技術(shù)參數(shù) |
參數(shù)描述 |
|---|---|
| MPXT4100 | 制造商:MOTOROLA 制造商全稱:Motorola, Inc 功能描述:X-ducer SILICON PRESSURE SENSORS |
| MPXT4100A7U | 制造商:MOTOROLA 制造商全稱:Motorola, Inc 功能描述:X-ducer SILICON PRESSURE SENSORS |
| MPXT4101A7U | 制造商:MOTOROLA 制造商全稱:Motorola, Inc 功能描述:X-ducer SILICON PRESSURE SENSORS |
| MPXT4105A7U | 制造商:MOTOROLA 制造商全稱:Motorola, Inc 功能描述:X-ducer SILICON PRESSURE SENSORS |
| MPXT5006D | 制造商:MOTOROLA 制造商全稱:Motorola, Inc 功能描述:INTEGRATED PRESSURE SENSOR |
發(fā)布緊急采購,3分鐘左右您將得到回復(fù)。