- 您現(xiàn)在的位置:買賣IC網(wǎng) > PDF目錄358736 > LA7386 (Sanyo Electric Co.,Ltd.) NTSC Video Signal Processing LSI for VCRs PDF資料下載
參數(shù)資料
| 型號: | LA7386 |
| 廠商: | Sanyo Electric Co.,Ltd. |
| 英文描述: | NTSC Video Signal Processing LSI for VCRs |
| 中文描述: | NTSC制式視頻信號處理LSI的錄像機 |
| 文件頁數(shù): | 3/13頁 |
| 文件大小: | 157K |
| 代理商: | LA7386 |
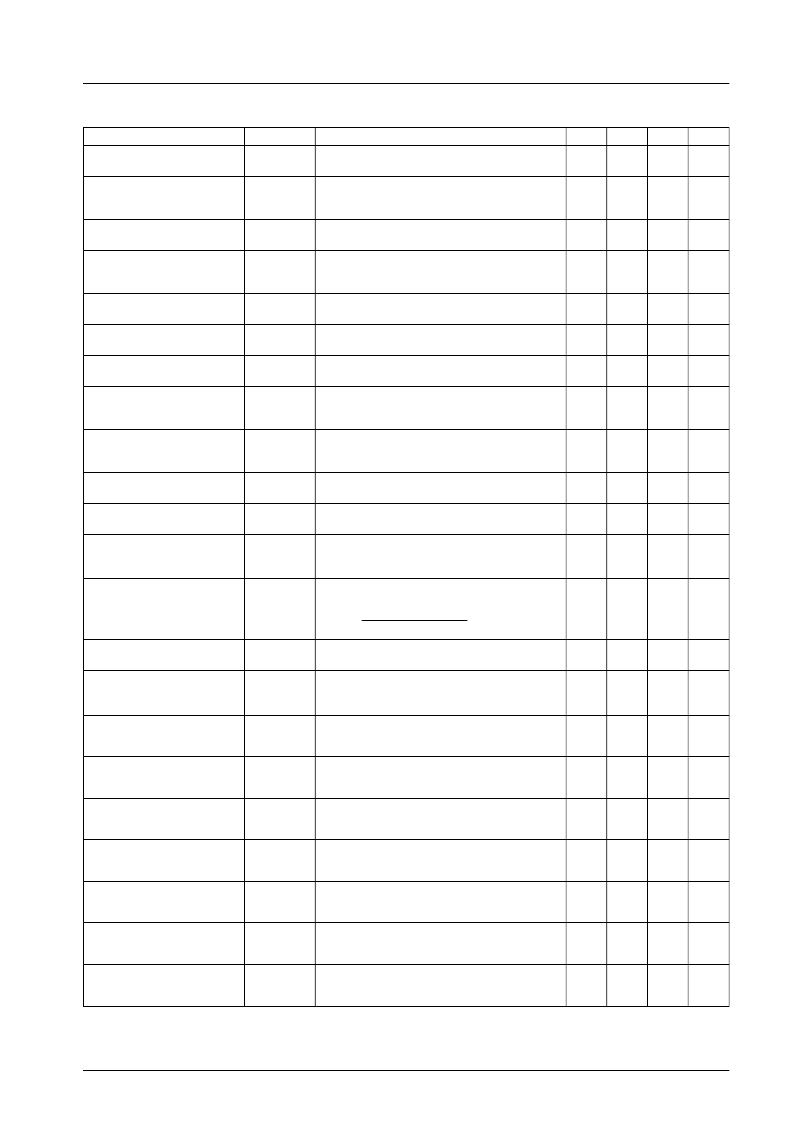
Continued from preceding page.
Parameter
Symbol
VR-YNR1
Conditions
min
10
typ
12
max
14
Unit
mV
REC YNR operation
EP/LP (1)
REC YNR operation
EP/LP (2)
Measure the YNR addition level at T2 with V
IN
=
standard color bar signal 1 Vp-p and S30 = off
VR-YNR2
Measure the YNR addition level at edit mode T2
with V
IN
= standard color bar signal 1 Vp-p and
S30 = off
Input a standard multiburst signal (1 Vp-p) and
measure the 4 MHz response for 500 kHz at T11
10 MHz response for 500 kHz at T11 when
V
IN
= standard multiburst signal 1 Vp-p and
S30 = off
1 MHz response for 500 kHz at T2 when V
IN
=
standard multiburst signal 1 Vp-p and S30 = off
2
3
4
mV
Pre-CCD LPF
frequency characteristics (1)
Pre-CCD LPF
frequency characteristics (2)
G
PFIL1
–0.5
0
+0.5
dB
G
PFIL2
–10
–8
–6
dB
3MLPF
frequency characteristics (1)
3MLPF
frequency characteristics (2)
3MLPF
frequency characteristics (3)
3MLPF
frequency characteristics (4)
G
3MLP1
–0.5
0
+0.5
dB
G
3MLP2
2 MHz response for 500 kHz at T2 when V
IN
=
standard multiburst signal 1 Vp-p and S30 = off
–1
0
+1
dB
G
3MLP3
3 MHz response for 500 kHz at T2 when V
IN
=
standard multiburst signal 1 Vp-p and S30 = off
–10
–8
–6
dB
G
3MLP4
3.58 MHz response for 500 kHz at T2 when
V
IN
= standard multiburst signal 1 Vp-p and
S30 = off
4.2 MHz response for 500 kHz at T2 when
V
IN
= standard multiburst signal 1 Vp-p and
S30 = off
No input, use VR36 to adjust output frequency to
4 MHz, measure output level
Ratio of 8 MHz component to 4 MHz in the above
state
Measure amplitude of change in output frequency
when 2.6 V DC or 3.1 V DC is applied to T3,
2 x (f3.1 – f2.6)
Measure output frequency when 2.85 V DC
applied to T3, f2.85
L
MOD
=f2.85 – (f3.1 + f2.6)/2
f3.1 – f2.6
–30
dB
3MLPF
frequency characteristics (5)
G
3MLP5
–15
dB
FM modulator output level
V
FM
0.89
1.0
1.12
Vp-p
FM modulator
secondary distortion
FM modulator
modulation sensitivity
H
MOD
–40
–35
dB
S
MOD
1.6
2.0
2.4
MHz/V
FM modulator linearity
L
MOD
x 100
–3
0
+2
%
1/2 f
H
carrier shift 1
C
S1
Measure amplitude of change in output frequency
when SW35B is from on to off and SW35A is off
Measure amplitude of change in output frequency
when SW35A is on and SW35B is switch from on
to off
V
IN
= 0.5 mVp-p 10 kHz sine wave
Measure ratio of levels of input and output
amplitude at T4
V
IN
= 158 mVp-p 2 MHz sine wave
Measure ratio of levels of T4 and T3, difference
with G
EMP
V
IN
= 50 mVp-p 2 MHz sine wave
Measure ratio of levels of T4 and T3, difference
with G
EMP
V
IN
= 15.8 mVp-p 2 MHz sin wave
Measure ratio of levels of T4 and T3, difference
with G
EMP
V
IN
= 15.8 mVp-p 2 MHz sine wave
Measure output amplitude at T4 in edit mode,
difference with G
EMP
V
IN
= 500 mVp-p 2 MHz
Measure ratio of levels of T4 and T3, difference
with G
EMP
V
IN
= 158 mVp-p 2 MHz
Measure ratio of levels of T4 and T3, difference
with G
EMP
6.8
7.8
9.5
kHz
1/2 f
H
carrier shift 2
C
S2
6.8
7.8
9.5
kHz
Emphasis gain
G
EMP
–0.5
0
+0.5
dB
Detail enhancer characteristics
(1)
G
ENH1
1.6
1.9
2.6
dB
Detail enhancer characteristics
(2)
G
ENH2
3.1
4.1
5.1
dB
Detail enhancer characteristics
(3)
G
ENH3
5.3
6.3
7.3
dB
Detail enhancer characteristics
(4)
G
ENH4
2.9
3.9
4.9
dB
Nonlinear emphasis
characteristics (1)
G
NLEMP1
0.5
1.4
2.3
dB
Nonlinear emphasis
characteristics (2)
G
NLEMP2
2.6
3.8
5.2
dB
Continued on next page.
LA7386
No.5472 - 3/13
相關(guān)PDF資料 |
PDF描述 |
|---|---|
| LA7390N | VHS-format VCR Video Signal Processor |
| LA7391AN | Global VHS-format VCR Video Signal Processor |
| LA7411 | Playback Amplifier and Record Amplifier for VHS VCRs |
| LA7411M | Playback Amplifier and Record Amplifier for VHS VCRs |
| LA7415 | VHS VCR Playback Head and Record Amplifiers |
相關(guān)代理商/技術(shù)參數(shù) |
參數(shù)描述 |
|---|---|
| LA7390 | 制造商:SANYO 制造商全稱:Sanyo Semicon Device 功能描述:VHS-format VCR Video Signal Processor |
| LA7390L | 制造商:未知廠家 制造商全稱:未知廠家 功能描述:VHS-format VCR Video Signal Processor(295.40 k) |
| LA7390N | 制造商:SANYO 制造商全稱:Sanyo Semicon Device 功能描述:VHS-format VCR Video Signal Processor |
| LA7391 | 制造商:未知廠家 制造商全稱:未知廠家 功能描述: |
| LA7391A | 制造商:未知廠家 制造商全稱:未知廠家 功能描述: |
發(fā)布緊急采購,3分鐘左右您將得到回復(fù)。